KINEMATIC ANALYSIS OF
HURDLING PERFORMANCES AT 2000 UNITED STATES OLYMPIC TRIALS
Alfred
Finch1, Gideon Ariel2, and John McNichols1
1Indiana
State University, Terre Haute, IN
USA
2Ariel
Dynamics, Inc., San Diego, CA USA
Video images of the third hurdle clearance by the finalists in the Men�s 110 m hurdles at the United States Olympic Trials were recorded from 3 camera views. Temporal and kinematic variables were calculated from the film records for the 4 competitors whose hurdle clearances were unobscured out of the 8 competitors. The mean foot contact time during the take-off was .142 s and the average flight time was .317 s. The hurdlers increased their horizontal velocity of the CM during the take-off stride by 13 cmhsec-1 and they increased their horizontal velocity of the CM at landing by 84.8 cmhsec-1. The hurdler elevated their CM from the take-off by 11.6 cm during hurdle clearance and a peak rise of 14.7 cm for the body�s CM was found at peak elevation. The apex of the flight trajectory occurred on the average 3.2 cm before the hurdle and the hurdler left the ground 224 cm before the hurdle and landed 143 cm behind the hurdle. Integrated multimedia analyses of their hurdling performances were presented at the USATF Elite hurdling development camp.
KEY WORDS: kinematic analysis, Elite
hurdlers, Olympic Trials
INTRODUCTION: The purposes of this
project were to collect video records of elite high hurdlers during the
2000 United States Olympic Trials, kinematically analyze their
performance, and immediately review the hurdling technique with the
athletes/coaches using an integrated multimedia presentation approach.
This project�s objectives were supported by the United States Track and
Field Hurdling Development committee for the identification and further
development of the elite hurdlers participating at the Olympic Trials.
Hurdling is a specialized form of sprinting that requires the clearance of
a series of hurdles. The goal of sprinting is to cover the distance in the
shortest time possible, in may be concluded that an athlete�s success in
the event may be influenced by their ability to produce the greatest
horizontal velocity. To
produce high horizontal velocities it is necessary to produce large
amounts of horizontal force while in contact with the ground. Therefore, the horizontal force
applied may be expressed by the following formula:
Horizontal Force = Mass � ( DHorizontal
Velocity) � Ground
Time-1
METHODS: Video records of 8 Elite high hurdlers were taken at 60 Hz from two front right and sagittal perspectives as they cleared the third hurdle during the high hurdle finals of the 2000 United States Olympic Team Track and Field Trials (See Figure 1).
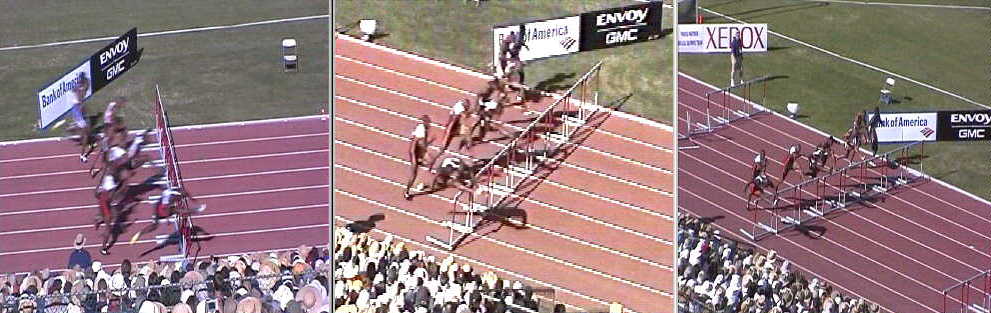
Only 4 hurdlers� performances were digitized due to obscured views as the flight passed over the hurdle. Fourteen body data points, 6 hurdle points (right & left top, base, & standard base), and the fixed reference marker on the video images of the hurdle trials were digitized, the coordinate data were scaled using an 3-DLT transformation, and then smoothed using a quintic spline filter. To examine the relationships between horizontal force production, contact time, and flight time, the temporal variables of foot contact time during the stride prior to take-off and flight time were determined. Kinematic data included the changes in CM horizontal velocity during foot contact at take-off, changes in CM horizontal velocity at landing after hurdle clearance, vertical elevation of CM during hurdle clearance from take-off, and horizontal displacement of the CM apex in comparison to hurdle clearance position. Additionally, the displacement of the foot at take-off from the hurdle, and the displacement of the landing foot from the hurdle were determined (See Figure 2).
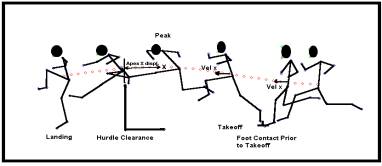
Figure 2.
Kinematic hurdle phases & variables
Technique analysis of the video records were reviewed with the athlete, his coach, and a member of the United States of America Track and Field (USATF) Elite hurdling development staff, the next day after the competition. Subsequent analyses using data integration techniques of the hurdler�s video records, stick figure reconstruction with the CM traced, and the kinematic data graphs of their hurdling trials were generated. These integrated multimedia displays are to be provided to the athletes at the USATF Elite Hurdling Development camp to be held at the United States Olympic Committee Training facility in Chula Vista, California (See Figure 3).
Figure 3. Integrated hurdle analysis from 2000 Olympic Trials
RESULTS AND
DISCUSSION: Means and standard
deviations of the temporal and kinematic data of the elite high hurdlers�
performances at the 2000 United States Track and Field Olympic Team Trials
were calculated and are presented in Table 1.
Table
1. Temporal & kinematic
data for 2000 Olympic Trials - 110m hurdles
| Variable |
D.
Wallace |
A.
Johnson |
L.
Wade |
T.
Dees |
Mean |
SD |
| Contact Time s |
.150 |
.133 |
.133 |
.150 |
.142 |
.010 |
| Flight Time s |
.333 |
.302 |
.300 |
.333 |
.317 |
.018 |
| Hor
CM Vel. Take-off
cm/s |
52.0 |
49.0 |
-69.0 |
20.0 |
13.0 |
56.5 |
| Hor
CM Vel. Landing
cm/s |
-33.5 |
9.3 |
180.1 |
183.3 |
84.8 |
113.3 |
| CM Elevation at Clearance |
1.0 |
9.2 |
21.4 |
14.9 |
11.6 |
8.6 |
| CM Vertical Displacement cm |
5.7 |
12.2 |
22.8 |
18.0 |
14.7 |
7.4 |
| CM Apex Hor Displacement cm |
-34.9 |
-17.2 |
0.6 |
38.8 |
-3.2 |
31.5 |
| Take-off Displacement cm |
261.0 |
218.1 |
210.8 |
208.3 |
224.6 |
24.7 |
| Landing Displacement cm |
95.8 |
174.9 |
164.3 |
140.2 |
143.8 |
35.1 |
The
mean foot contact time calculated for the step going into the hurdle for
this study�s elite high hurdlers were slightly faster than the 0.135 s
contact times reported by R. Mann (1993) in the Elite Hurdler Project
technical report. But these
values were slightly slower than the .122s foot contact times for the
American Elite hurdlers determined by Finch, Ariel & McNichols
(2000). In the present study,
the flight times were found to be similar to the .31 s flight times
determined for the good elite hurdlers analyzed in the 1993 project and
faster than the reported .366 s flight times determined at an American
Elite Hurdling development camp.
The shorter flight times may be attributable to the present study�s
elite level of training and the competitive nature of the Olympic Trials.
The high hurdlers elevated their CM approximately 11.6 cm at hurdle
clearance above their CM position at take-off during the hurdling movement
and they attained a peak CM height of 14.7 above their CM take-off
position. The high hurdlers� horizontal displacements between the apex of
the CM trajectory and the hurdle ranged from 34.9 cm in front of the
hurdle to 38.8 cm after the hurdle.
The hurdlers� mean horizontal displacement of the apex was 3.2 cm
before the hurdle. Therefore some of the hurdlers need to work on their
strides going to the hurdle and the CM projection trajectory, in order to
make their CM flight trajectory apex coincide with the hurdle clearance
position rather than in front.
If this alignment of the trajectory peak was made then the hurdlers
would not need to produce as great an elevation and shorter flight times
would result. Only, one of
the high hurdlers� CM peak trajectories coincided with the hurdle
clearance. The
hurdlers� average take-off distance was 224.6 cm and their landing
distance was 143.8 cm. These
displacements were very close to the 213 cm (7 ft) take-off and 122 cm (4
ft) landing displacements, that are typically discussed by hurdle coach
clinicians. The alterations in the horizontal velocities of the CM during
the take-off found that the high hurdlers increased their velocity by 13
cmhsec-
1 or approximately 1% of their running velocity. These accelerative changes in the
horizontal velocities for the hurdlers would be indicative of an
appropriate stride length foot at foot plant prior to take-off. During the landing phase, the
hurdlers experienced an acceleration of 84 cmhsec-1
or about 7.6% of their running velocity, as they came over of the hurdle,
which would be indicative of the hurdler landing in a tall running
position rather than settling and retarding their running velocity. The
application of greater horizontal forces would be indicated by shorter
ground contact times and those horizontal forces may only be generated
when the hurdler is contact on the ground, therefore long flight times
while clearing the hurdle would not be beneficial in achieving fast
hurdling times. The small
vertical CM displacements observed for the hurdlers during hurdle
clearance indicated that the hurdlers strode over the hurdle, thus
reducing the flight time and increasing the acceleration of the body when
in contact with the ground.
CONCLUSIONS: The hurdlers
experienced their greatest acceleration during the landing phase after the
hurdle clearance than the step prior to take-off. Only one of the four
hurdlers� apex of their CM flight trajectory occurred over the
hurdle. The hurdlers� apex of
their CM parabolic pathway should occur while clearing the hurdle. A horizontal displacement between
the CM apex and the hurdle would be indicative of improper striding or
flight trajectories, where the take-off step occurred too close or too far
from the hurdle or they projected their body at an improper angle. An apex displacement would
indicate that the hurdler reached his peak flight position either slightly
before or after the hurdle. The simultaneous integration of video, stick
figures and data was used as a visual coaching and research tool for
performing a hurdle analysis and providing immediate feedback to the
athlete and coach.
REFERENCES:
Finch, A., Ariel, G., & McNichols, J. (2000). Integrated kinematic data analysis of American elite hurdlers. In: Proceedings of International Symposium on Biomechanics in Sports XVIII, The University of Hong Kong, Hong Kong, China.
Mann, R. (1993). The mechanics of sprinting and hurdling. Elite Hurdler Project technical report. United States Track & Field Association, 1-135.
McDonald,
C., & Dapena, J. (1991). Linear kinematics of the men�s
110-m and women�s 100-m hurdles races. Medicine & Science in Sports &
Exercise, 23:1382-91.
See Also
| Fast-Twitch | The most technologically advanced physical fitness training system available ... thanks to the Ariel Exercise System |
| Functional | Functional Capacity Evaluation |
| Hurdling | Kinematic analysis of hurdling performances at 2000 United States Olympic trials |
| Library | Online academic library |
| List | List of Publications |
| NASA | What is a Resistive Exercise Dynamometer? Read on, and learn how Ariel Dynamics participates in and contributes to America's Space Program. |
| Optimization | Optimization of Human Performance for All Ages |
| Presentations | Presentations |
| Projects | Miscellaneous projects using ADI products |
| Publications | Gideon B. Ariel, Ph.D. - Publications |
| Publications | Publications in scientific journals |
| Quaternions | Visualizing Orientation using Quaternions |
| Research | Research and Development |
[Back to Introduction]