|
|
Squat Jump |
[FrontPage Include Component] |
|
|
|
|
|
|||||
|
NAVIGATOR: Back - Home > Adi > Services > Support > Tutorials > Apas > Bar Lift : |
|||||
|
|
|||||
| |||||||||||||||||||
|
Squat Jump
Categories
|
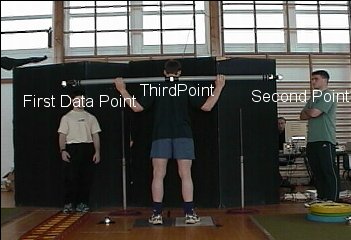
Analysis of a squat jump with a barThe purpose of this document is to show how to calculate various kinematics parameters while squat jump with a weight bar. The Power and Energy algorithms were added specifically for an experiment conducted by Dr. Mike Stone and Dr. Ross Sanders. The motion video that are shown in this tutorial is compressed, and not every frame was capture in order to save disk space. However, in a real situation the video resolution set at 720 x 480 at 60 frames per second. The camera used was the JVC 9800 which is capable of sampling up to 240 frames per second. Subjects held the Bar in a squat position and perform the Squat Jump exercise while video data was collected at 60 Frames per Second. The video was captured and trimmed as described in the Tutorials. The following video illustrate one of the trials. The first process require to digitize the sequence. Three points were selected.
The following image show these points.
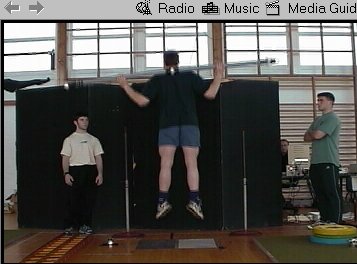
The reason we selected the points in this order is to be able to connect the first and second point to represent the full bar length to allow latter on, segment calculation to determine Energy, Power, and Force. Capturing and Trimming was performed on the raw data as described in the Tutorials. The next process is Digitizing. Digitizing can be done automatically and manually. For the automatic digitizing you must have distinguish reflective markers which could be any color as long as it is different from the background. The better the contrast between the foreground and the background, the better the automatic digitizing can be done. In the present study, one can observe that the background was set black against the foreground. However, the right reflective marker some times conflict with the background when it is stand against the wall or specifically against the lighted window. The next image show the problem:
Under this condition the automatic digitizing will stop and require the operator to digitize the point manually. It is always advise to check the video after the first trial to verify that the video session capture what you want to capture with the correct condition. However, the APAS system will always allow you to continue the analysis manually if it cannot detect the point due to the bad contrast. The process of digitizing start with defining the basic parameters required for the sequence. The following video illustrate the process of inputting the require parameters such as the body's weight, body's height, connecting points, etc. (click here). As one can see, the following points were selected: L2; L3; and R2. The reason is that consecutive points always will be connected and none consecutive will not. This why the mid-point R2 was selected as the third point, not to create an additional segment. For more detail please read the digitizing manual. Another particular set of parameters must be inputted differently from normal analysis, in order to calculate, Power, Energy and Force. For these parameters to be calculated correctly, one must input the weight of the bar and set the Relative/Absolute to Absolute since the Mass of the bar is the absolute value. It is also possible to input the total of the mass of the body and the bar, and then, use the Relative function to represent the fraction of the mass of the bar relative to the Body's mass. So, for example, if the bar weigh 50 Kg, one can input the absolute value of 50 Kg. into the Abs/Rel parameter box. Or, if the body weight is 100 Kg. and the bar is 50 Kg. one may input the ratio of 50/150 which is the mass of the bar over the total mass. This will represent .333 input at the Rel/Abs box. The location of CG should set to .5 as the mid point of the bar and the Radius of Gyration should be set to .6. This value is not used in this calculations. The following video represent these processes. After inputting the data as described above, the next process require to define the points for the automatic digitizing. The next video shows the setting again to the point where the video file is selected. (click here). The next video shows one frame of the video in process. The next step is to define the markers, so, various image processing parameters will be stored for the following automatic digitizing. And then the automatic digitizing start. The Next video shows this process One process is necessary and many times forgotten by many investigators. You must digitize the Calibration Frame. This Calibration Frame can be recorded in the same video sequence, or on separate video file. It is preferable to have the Calibration Frame to be videoed and stored on separate video. You need only one or two frames for this process. Therefore, in the Trimming module you should trim the calibration frame to only 2 fields or just few more, so you can select the best one. The Next Video shows the calibration frame. The Next Video shows the process of digitizing the Calibration Frame. It is very important to remember the sequence of points as defined at the Digitizing Module. For this analysis we are dealing with only 2D analysis and therefore only 4 points are required for the Calibration Frame. At that point the digitizing is finished. The next process is the transformation to calculate the x, y coordinates in 2D. The next video shows the Transformation Process. A detail discussion of the Transformation Module is discussed in the manual here. The next process is the Filtering. You must filter the data in order to eliminate digitizing noise as well as creating derivatives to calculate velocities and accelerations. The next video shows the filtering process. A detailed discussion of the Filtering Module is discussed here. Now that the digitizing, transformation and the filtering is done, it is possible to analyze the results. For analyzing the results we are going to use the Display Module. A complete tutorials how to use the Display module is explained here. The next video shows the use of the Display Module with the Bar Lift analysis. Upon the request of Dr. Mike Stone and Dr. Ross Sanders, 3 more functions were added to the Display Module.
These functions were added in order to calculate these functions to the weight bar segment. In order to do that, the Mass of the bar must be known and input into the digitizing module. In addition, the location of the Center of Mass should be changed from Relative to Absolute and set to .5 which means 50 percent of the length of the bar rather then percent relative to the body's height. The following video describe these procedures. Now that all the parameters are inputted, it is possible to calculate the Power and Energy as shown in the following video. |
|
|