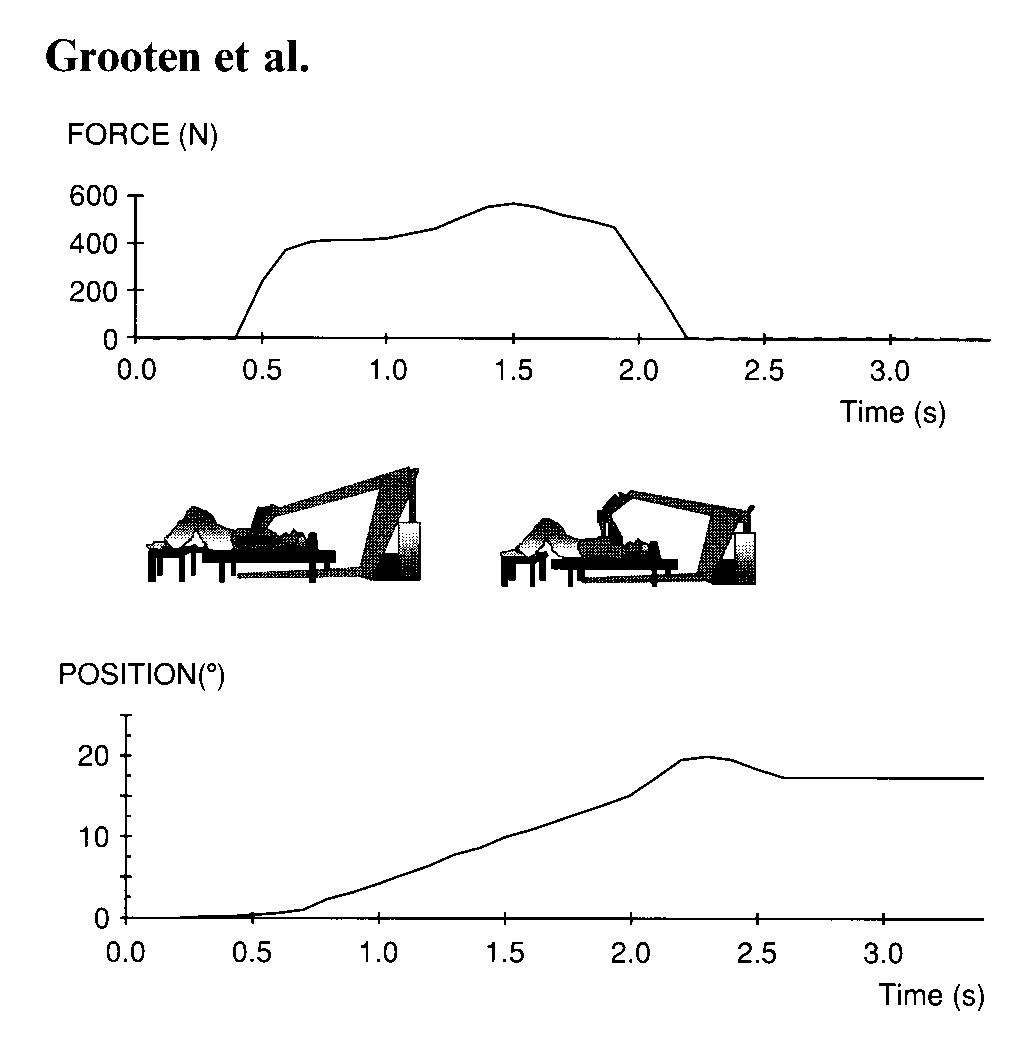
Fig. 2. A typically raw registration of one supine bench press in the isokinetic mode with a velocity of 10°/s. The lower curve (POSITION) shows the movement of the resistance arm (degrees) and the upper curve (FORCE) shows the force (N) the subject put against the resistance arm of the ACES. Time in seconds (s).
coefficients (ICC[2 11) for each output parameter. The SEM is related to the ICC, but they convey different information about reliability (Stratford & Goldsmith, 1997). The Standard error of the measurement (SEM) is calculated by taking the square root of the total variance times (1-ICC) (Stratford & Goldsmith, 19974). The SDD, sometimes called the repeatability (Bland & Altman, 1996), is calculated by taking the SEM times 1.96 times the square root of 2 (Roebroeck et al., 1993). The Coefficient of variation (CV) is the method error (ME)5 divided by the mean of all the observations from test session 1 and test session 2 times 100% (Holmback et al., 1999). The measurements were first tested for normality using Levee's test. Bland and Altman (1996) recommend checking the assumption that the standard deviation is unrelated to the magnitude of the measurements by plotting the individual subjects' standard deviations against their means. These calculations were done with the use of the computer packages Statistica© (version 5.0) and Excel (version W98-7.0, Microsoft').
Results
In total, 23 healthy female subjects completed the study. One subject had ischial complaints after the pre-test and was excluded from the study.
3The formula (BMS-EMS)/(BMS +EMS +k(JMS-EMS)/n) was used, where BMS is the mean square of variation between subjects, JMS is the mean square of variation within subjects, EMS is the residual mean square, k is the number of repetitions, and n is the number of subjects.
4SEM=,/rT2(l-p). QT = total variance; p = ICC. 'ME 2 = EMS.
Table 1. Mean and standard deviations (SD) of the muscular performance parameters peak and average force, peak and average power, and total work in two different isokinetic velocities (10°/s and 25°/s). Mean of three sets on each day; each set contains three repetitions of supine bench press (n = 23)
|
Day 1 |
Day 2 |
|||
|
10°/s |
Mean |
SD |
Mean |
SD |
|
Peak force (N) |
559.6 |
90.5 |
557.0 |
89.0 |
|
Average force (N) |
465.4 |
69.7 |
463.7 |
72.9 |
|
Peak power (W) |
152.5 |
24.0 |
151.2 |
24.0 |
|
Average power (W) |
120.4 |
18.7 |
119.8 |
20.5 |
|
Total work (J) |
447.9 |
79.4 |
448.0 |
78.5 |
|
25°/s |
Mean |
SD |
Mean |
SD |
|
Peak force (N) |
411.4 |
48.8 |
415.8 |
50.8 |
|
Average force (N) |
355.5 |
42.9 |
358.4 |
44.0 |
|
Peak power (W) |
283.7 |
45.3 |
277.2 |
59.1 |
|
Average power (W) |
209.0 |
34.8 |
204.3 |
47.0 |
|
Total work (J) |
343.1 |
53.9 |
344.0 |
54.1 |
Reliability
The means and standard deviations of three sets per day are presented in Table 1.
Table 2 presents the ICC values, SEM values, CV, and SDD of the mean of three sets. The values for ICC are nearly all above 0.75. Only total work at 25°/s lies under this limit of excellent relative reliability (Fleiss, 1986). The ICC values are higher at 10°/s than at 25°/s. The Standard error of the measurement (SEM), CV, and SDD were used to calculate the absolute reliability. The lowest values are found at 10°/s, indicating again that the slow isokinetic velocity provides higher reliability in most parameters than isokinetic bench press at moderate velocity.
Discussion
The results of this study indicate that excellent to good reliability can be achieved in repeated-measurement testing of healthy women in maximal isokinetic supine bench press with the ACES `multifunction exerciser' using the mean of three sets at two isokinetic velocities. Fleiss (1986) states that an ICC value above 0.75 represents `excellent reliability' and a value below 0.75 represents `good reliability'. Therefore, excellent reliability was obtained at 10°/s (ICC values between 0.947 and 0.755), and good reliability was obtained at 25°/s (ICC values between 0.861 and 0.654). The SEM and the CV again indicate higher reliability in the slower velocity in most parameters. Of the parameters studied, `total work' had the lowest reliability but is still useful in clinical situations.
It is of clinical relevance to measure at the individual level, and it is therefore necessary to calculate the SDD to see whether a therapy or other intervention has an effect on muscular performance, or only a statistical artefact is present. The values of the SDD in this study can be used for clinical purposes, but one should be
220