|
|
Methods |
[FrontPage Include Component] |
|
|
|
|
|
|||||
|
|
|||||
| |||||||||||||||||||
|
Methods
Categories
|
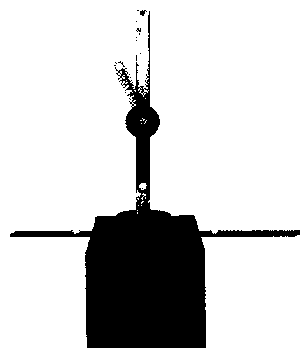
METHODSInstrumentationThe Ariel Performance Analysis System is a passive marker video analysis system that can provide both kinematic and kinetic analysis of a motion sequence. The current study is limited to kinematic functions. The system can analyze multiple views of a dynamic model delineated with up to 30 markers. The manufacturer reports an error estimate of 1% for linear spatial measurements and approximately 10% for measurements of acceleration. Software for digitizing images and extracting values for various physical variables from these images is provided with the instrument. Ariel version 6.5 software was used in the analysis of data in this study. Additional hardware included a 386 AST IBM compatible computer, two video monitors, an editor quality Panasonic VCR (model AG 6300), and two video camcorders (Panasonic model PV 700). For portions of this study, the video cameras were fitted with wide-angle conversion lenses (Panasonic model PV-LW49 X's 0.7). There were five general steps in the three-dimensional (3D) data collection and analysis process. A video record of the event of interest was recorded. The video records from one or multiple views of a specific motion sequence were grabbed from the video record and they were converted into computerized video images. Marker or joint positions were digitized into Cartesian spatial coordinates. Views from two or more cameras could then be mapped onto a 3D coordinate system by the computer using an internal direct linear transformation algorithm. The system software offers a choice of smoothing algorithms for reducing digitizing error. Once the data were grabbed, digitized, transformed, and smoothed, they were ready for final analysis and interpretation. Reference standards included a meter stick partially covered with black paper to reduce light reflection, and a plastic 25cm 360 deg universal goniometer with 1 deg increments firmly attached to a black wooden stand (fig 1). Two spherical markers 1cm in diameter (wooden craft furniture buttons) covered with reflective tape were firmly attached 50cm apart on the meter stick. Three similar markers were attached to the goniometer at the axis and near the ends of each arm.
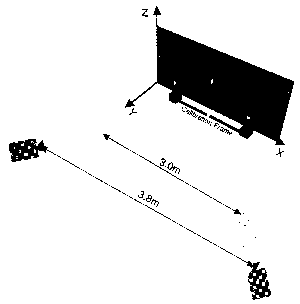
The goniometer was calibrated against a set of reference triangles. These triangles were pencil and paper drawings, constructed using the trigonometric functions and a calibrated ruler. Consequently, in this study, a distinction is made between the goniometer setting and the reference angle, the former referring to the value obtained by taking a reading from the goniometer, and the latter referring to the true value which that reading represents as a result of calibrating the goniometer against the primary standard. The linear standard was compared with the same 50cm interval on 21 other meter-sticks from various manufacturers, purchased at different times. On average, the standard used in this experiment differed from the others by -0.8 +/- 0.036mm. Measurements of the linear standard and the angular standard were conducted in a data acquisition region that consisted of a rectangular volume 2m wide x 0.7m deep and 1.35m high. The floor of this region was covered with a dark gray rug runner and a black felt backdrop was hung at the rear of the data acquisition region to reduce light reflection. There were two camera placements used. For primary placement, the camera pair was positioned 3.8m apart, 3.8m from the front of the data acquisition region, and 1.75m high (fig 2). An alternate, secondary placement was used in the tests that used the use of a wide-angle conversion lens. For those tests, cameras were placed 3m apart, 3m from the front of the data acquisition region, and 1.75m high.
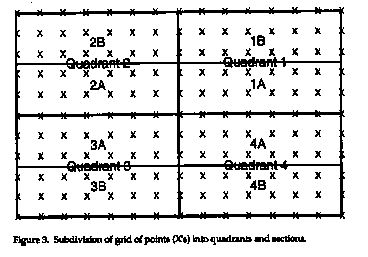
ProceduresThis study was conducted in the form of a series of tests to examine several parameters of measurement interest. These included absolute and relative point estimation, accuracy of linear estimates, accuracy of a range of angular estimates, consistency of angular estimates of a model moving through the data acquisition field, and consistency of angular measurements when an object is rotated in the field. Research protocol. A series of preliminary tests was conducted to investigate the effect of calibration procedure and camera placement on the internal consistency of linear measurements. The data acquisition region was calibrated using a rectangular frame constructed of metal pipe to which reflective tape was attached at various locations (fig 3). The frame coincided with and was identical in size to the data acquisition region, 2m wide x 0.7m deep and 1.35m high, as noted previously. These tape attachments served as the calibration points in analysis. By varying the selection of calibration points, spatial configurations corresponding to three different calibration field widths and two calibration point variations were compared on the basis of their ability to yield consistent and accurate measurements of the test object throughout the data acquisition region.
For each frame configuration, tests for two combinations of camera placements and lens conformations were conducted. One set of tests used the primary camera placement and the standard optical components (fig 2). The second set of tests used the wide angle conversion lens and the alternate camera placement, ie, the placement of the camera converted with a wide-angle lens was varied to keep the field of view of the camera approximately constant across the two test sets. For each set of tests, the variable calibration frame was placed into the data acquisition region, filmed, and then removed. The linear standard oriented in the xz-plane was then filmed as it rode on a wheeled cart pushed manually along the x-axis at an average speed of approximately 0.75m/sec. Subsequent computerized analysis of the motion of the cart confirmed that the instantaneous values for this speed did not vary by more than +/- 15% from the average value. Motion sequences were auto-digitized, transformed, and smoothed using a low pass digital filter (10Hz). The choice to use a digital filter at 10HZ was made to minimize any smoothing effect on raw data to thereby avoid masking any inherent system error.
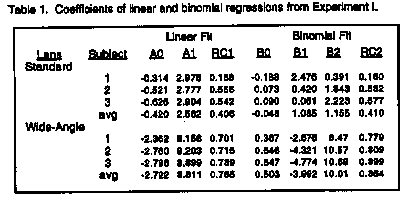
Test results are presented in Table 1. Overall accuracy of measurements across the data acquisition field were found to be clinically acceptable (mean length error <3.5mm) for all tests using the first optical conformation (no conversion lens). The 2m calibration field width using 22 calibration points exhibited the smallest variability in estimating the length of the linear standard throughout the data acquisition field (SD 3.Omm). The second set of tests using the wide-angle conversion lens displayed more variability. Increasing the dimensions of the calibration frame or the number of calibration points beyond 22 improved neither the accuracy nor the consistency of measurement. Based on these data, a study protocol using the 2m wide calibration frame marked with 22 calibration points was adopted (fig 3). Point estimation. The accuracy of the system in reconstructing absolute spatial coordinates was examined for the 22 calibration points. Twelve additional points as well as a single point marking the center of the calibration frame were subsequently examined. These 12 markers were located on the calibration frame equidistant from the calibration points, and displaced from them along the x-axis only. The marker in the center of the calibration frame was displaced from the calibration points along all three axes (x, y, and z). The precision of the absolute spatial coordinate estimation was examined by repeated analysis of reconstructed estimates for the center point only. Point estimation tests were conducted with the cameras in their primary configuration (fig 2). As discussed previously, there always exists some inherent digitizing error. Representation of this error was intentionally preserved in this study by minimizing the effects of the data smoothing algorithms. In addition, a point data value (from a single video frame) was recorded rather than a mean value (averaging of several video frames) so that system error would not be masked by the averaging of data. To this end, the calibration frame was filmed and 11 consecutive video frames were grabbed from the video record of each camera. These motion sequences were then digitized, transformed, smoothed, and analyzed. The spatial data from the sixth video frame was recorded. Using this procedure, the 22 calibration points were analyzed first, followed by the 12 additional displaced markers. Then a repeated- measures test was performed for the center point to determine both accuracy and precision of the point estimation. For this last analysis 10 different film sequences of 11 video frames each were grabbed from each video record, auto-digitized, transformed and smoothed, and, as described previously, spatial data for the sixth frame for each analysis were recorded. Length test 1. This test assessed the system accuracy for length estimation. Two markers placed at a known distance from each other on a meter stick served as the standard for this test, and the primary camera placement was used. The experimental procedure was similar to one described by Haggard and Wing.' The data acquisition region was divided into 27 cell segments of roughly equal size to allow for a systematic survey of the entire data acquisition region. The rigid linear standard was placed on a support of variable height and oriented so that it lay in the xz,-plane in the approximate center of one of the segmented cells. This procedure was repeated for each of the segmented cell regions. Each placement sequence was videotaped for approximately 3 seconds. Eleven video frames were grabbed for each placement sequence, auto-digitized, transformed, and then smoothed. The length estimate derived from the sixth frame of each sequence was recorded, as explained previously in the section on point estimation. Length test 2. A second length test was performed using the alternate camera placement and wide-angle conversion lenses. In all other respects the procedures for model placement and data acquisition and analysis was the same as for Length test 1. Angular accuracy. A repeated-measures test, similar to that described by Vander Linden and coworkers(6), was performed to assess the accuracy of angular estimation. This test was performed using the primary camera placement and the angular standard. For these tests a goniometer mounted on a wooden base was placed in the approximate center of the data acquisition region (fig 1). The angles of the goniometer were aligned in the xz.-plane. The movable goniometer arm was manually positioned at each angle starting at a goniometer setting of 10-degrees and moving to 180-degrees in 10-degree increments. This procedure was repeated 10 times generating a total of 180 angular sequences. Each angular sequence was filmed for approximately 3 seconds and 11 video frames were grabbed. All sequences were auto-digitized except for data at 10-degrees which were hand-digitized because the arm markers were so close to each other that the computer could not distinguish between them when in the auto-digitizing mode. The data were then transformed, smoothed, analyzed, and recorded. A mean value (n = 10) and standard deviation for each angle was calculated. Angular Consistency. The ability of the system to reconstruct consistent angular measurement estimates regardless of the position of the object in the data acquisition region was assessed using a procedure similar to the one described previously in the initial protocol tests. The goniometer was mounted on the wooden stand and wheeled through the data acquisition region along the x-axis. The goniometer was aligned to lie in the xz-plane just as in the angular accuracy tests. The primary camera placement was used. Film sequences were acquired for five goniometer settings ranging from 30-degrees to 150-degrees in increments of 30-degrees. These motion sequences were subsequently auto-digitized, transformation, smoothed, and analyzed. Mean value and SD were used to assess system accuracy and consistency. Angular rotations. These tests assessed the system consistency of angular estimates when the goniometer did not lie in the xz-plane. Similar to the previous angular consistency test, five goniometer settings from 30-degrees to 150-degrees in 30-degree increments and the primary camera position were used. The goniometer mounted on the wooden stand was placed on the floor in the approximate center of the data acquisition region. In turn, the movable arm of the goniometer was positioned for each reference angle and then the base of the wooden goniometer stand was systematically rotated. Six rotation placements, defined by the angle between the x.,-plane and the plane defined by the goniometer angles, were assessed for each reference angle. The rotational placements studied were 45-degrees, -30-degrees, -15degrees, 15-degrees, 30-degrees, 45-degrees. Estimates beyond 45-degrees of rotation in either direction, could not be analyzed because, in these placement positions, the marker on the movable arm was no longer visible in at least one of the camera views. Eleven video frames were grabbed for each rotational placement. Respective views for angular placements were transformed, smoothed, analyzed, and recorded. |
|
|