|
|
Calculations |
[FrontPage Include Component] |
|
|
|
|
|
|||||
|
NAVIGATOR: Back - Home > Adi > Services > Support > Tutorials > Gait > Chapter5 : |
|||||
|
|
|||||
| |||||||||||||||||||
|
Calculations
Categories
|
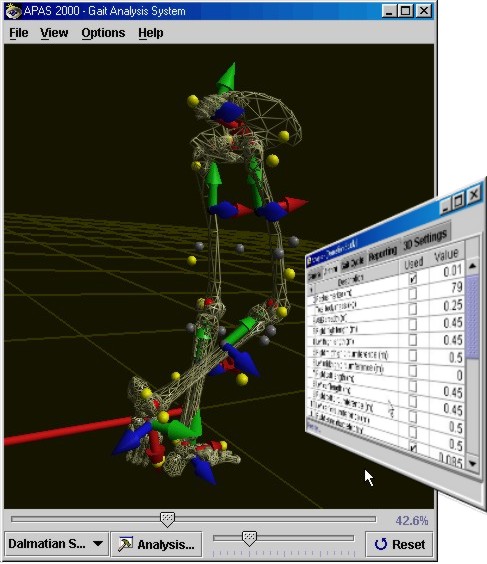
CalculationsPrediction of Joint CentersReference: Vaughan. "[...] It is possible to use the 3-D positions of external landmarks and anthropometric data to predict the 3-D positons of internal skeletal landmarks (i.e., the joint centers). Some coefficients in these models are based on direct 3D measurements of 12 normal subjects, while others are based on stereo X rays of a normal subject (Vaughan, 1983). The biomechanics literature desperately needs coefficients that have been derived from many subjects, both normal and abnormal." Each of the available marker sets dictates its own model to predict the location of the joint centers. APAS/Gait currently has many models (marker sets) to process kinematic data. It is possible to visualize both input (markers) and the resulting joint centers in 3D space. We believe that this will assist the user in determining if the predicted joint centers are reasonable or acceptable. This allows for some interesting possiblities, for example a direct comparison of different marker sets. This can be accomplished quite easily because the different marker sets have many markers in common. Also the influence of anthopometric settings on the underlying models can be visually explored. Note that it only takes 3 markers per segment to determine a segment's orientation in space. APAS/Gait is designed to accommodate new models easily. If you are interested in adding other published marker sets to APAS/Gait, we'd love to hear. Or we can work with you to develop a custom model specific to your needs. Contact us at gideon@arielnet.com for more information. Determination of Segment OrientationReference: Vaughan. "The final task is to determine the orientation of each segment in 3-D space. This is done by embedding a reference system (xyz) in each segment that will define how each segment is positioned relative to the global (i.e., laboratory) reference frame XYZ. The location of each xyz reference frame is at the segment's center of gravity." In APAS/Gait, the xyz local reference frames are attached to the segment's center of gravity and can be displayed in real-time (see screen shot below, it based on the included demo file NORMAL_4MS.3D). Markers that are used in the marker set of choice are displayed as yellow balls, unused markers are displayed as gray balls. These extra markers are present to allow the user to select different marker sets on the same data. Calculated joint centers are visualized as red balls. Note that the system will automatically scale the bone geometry to match your data exactly: this may mean that bone geometry will automatically grow and shrink if the segment length is not constant within a trial.
Joint AnglesReference: Vaughan. "There has been some debate as to the most appropriate method of defining joint angles so that they make sense from a traditional, anatomical point of view. We have decided that the most sensible method has been proposed by Chao (1980) and Grood and Suntay (1983). Consider the segment reference frames. Each joint has a reference frame in the proximal and distal segments (for the hip joint, this is the pelvis and thigh; for the knee joint, the thigh and calf; for the ankle joint, the calf and foot). Joint angles are defined as a rotation of the distal segment relative to the proximal segment. The rotations may be defined, in general, as follows:
|
|
|