|
|
Results |
[FrontPage Include Component] |
|
|
|
|
|
|||||
|
NAVIGATOR: Back - Home > Adi > Products > Apas > Comparison : |
|||||
|
|
|||||
| |||||||||||||||||||
|
Results
Categories
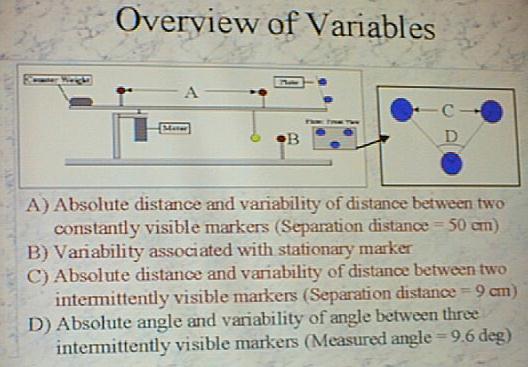
| ResultsSlide 11 illustrates the device with the markers placed 9 cm apart,
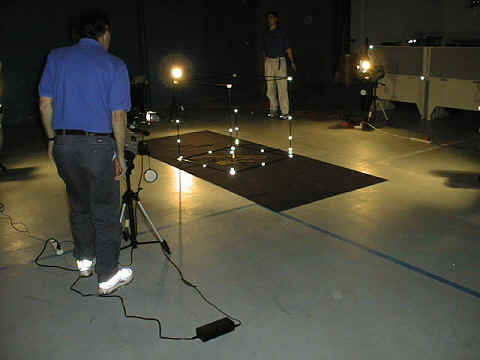
Slide 11. Measurement for the 9 cm test (C). The slide was photographed at the original session. Slide 12 illustrates the actual device at Dr. Richards' laboratory while collecting the data.
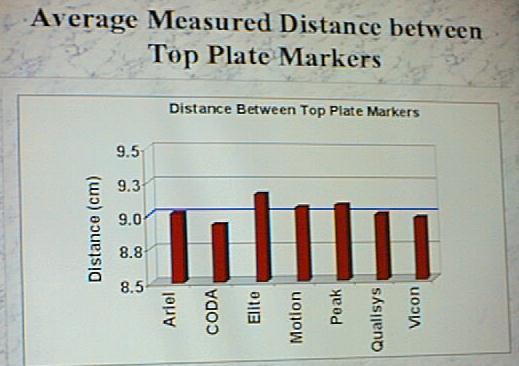
Slide 12. Actual data collection session at Dr. Richards' Laboratory. Slide 13 illustrates the average measured distance between top plate markers. The results for the measurement of the distance between the top two markers on the rotating plate is presented in Table 1. The known distance between the two top plate markers was 9.0 cm.
As reported during the original presentation based on the test results, APAS performed the best in determining the actual 9 cm by detecting the distance as 9.015 cm.
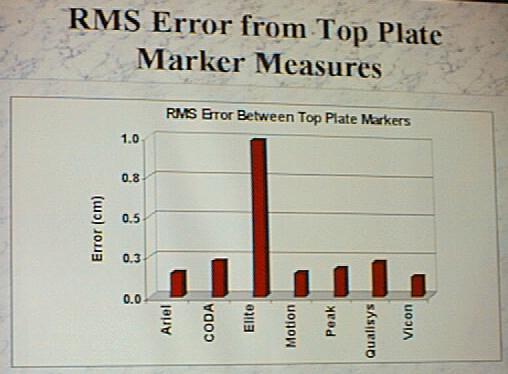
Table 1. 9 cm test results Slide 13 illustrates the bar diagram for the 9 cm measurement and Table 1 illustrates the actual data obtained for the different companies. Slide 14 illustrates the RMS bar diagram.
In Slide 14 it is clearly demonstrated that APAS had the lowest error. The unrealistic results obtained by Elite can be seen and, for this reason, the author of the report decided not to include their results. As one can observe, APAS yielded 9.015 cm with the lowest error of .087 cm. The total error amounted to the sum of the RMS and the maximum error and was the best of all systems. APAS scored 20 points for this test with Vicon second with 15 points. In all cases, APAS performance was superior to all other companies. APAS scored first with 20 points. The second best performer was the Vicon company. However, remember that the switching points errors were not considered. Had the switching points been considered for Vicon, the error would have increased significantly. |
|
|